Introduction
Welcome to FinSxS. If you are new to the platform, you might have noticed that we don't just list prices, we organize the global economy into sectors, industries, and specific instruments.
Whether you are using the Market Discovery tool or asking the AI Assistant for data, understanding the underlying asset classes is critical. This guide explains the main assets you can track and how to use FinSxS’s specific tools to analyze them.
Core Asset Classes Explained
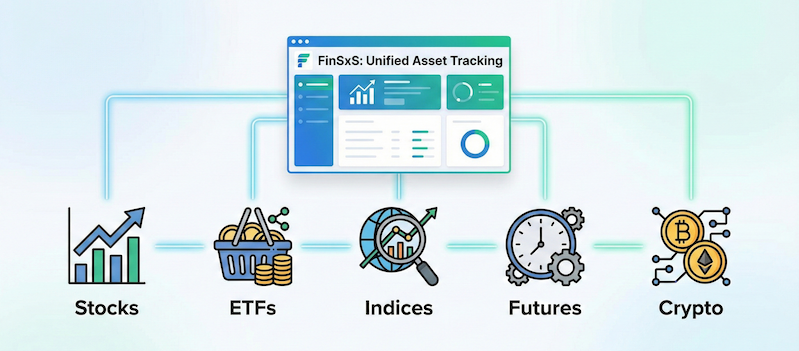
Here is a breakdown of the financial instruments available in the FinSxS database and how to utilize them.
1. Stocks (Equities) & Organizations
Stocks represent ownership in a corporation. On FinSxS, we organize stocks under Organizations.
How to find them: Use the Market Discovery page. You can filter by Location (e.g., "Europe", "Netherlands") or Sector.
3. ETFs (Exchange-Traded Funds)
ETFs are baskets of assets that trade like a single stock. They are the easiest way to diversify.
2. Indices & Benchmarks
An index tracks a group of stocks to measure market health. You cannot "buy" an index directly on the exchange, but you use it to measure success.
4. Futures
Futures are financial contracts obligating the buyer to purchase an asset or the seller to sell an asset at a predetermined future date and price.
4. Cryptocurrencies
Crypto assets are digital currencies that operate on decentralized networks.
Bonus: Commodities You may also see Gold, Silver, or Oil in our navigation. These are often held via ETFs or Trusts to protect against inflation. FinSxS allows you to mix these hard assets into your digital portfolio view seamlessly.
How FinSxS Makes Investing Easier
Most platforms keep your crypto in one wallet, your stocks in a brokerage account, and your market research on a news site. FinSxS brings this all together.
1. The Unified Dashboard Stop switching apps. On FinSxS, you can see your Apple stock, your Bitcoin holdings, and your Gold ETF in a single pie chart. We handle the multi-currency conversions automatically, so you see your total net worth in one number.
2. Normalized Charts Comparing the price of Bitcoin ($90,000+) to a share of Ford ($12) is visually impossible on a standard chart. FinSxS uses percentage-based normalized charts, allowing you to fairly compare how these assets perform relative to each other over time.
3. Watchlists & Simulations Not ready to spend real money? Create a Watchlist. Add the assets you are interested in and track them for a few weeks. It’s the best way to "paper trade" and learn market rhythms without risk.
Quick Tips for Beginners
Next Steps
Ready to apply what you've learned?