Welcome! This quick guide shows you the easiest way to explore FinSxS. We recommend starting with Market Discovery and Watchlists to get a feel for the data, and only moving to real portfolio tracking when you are ready.
No pressure, just fun first steps.
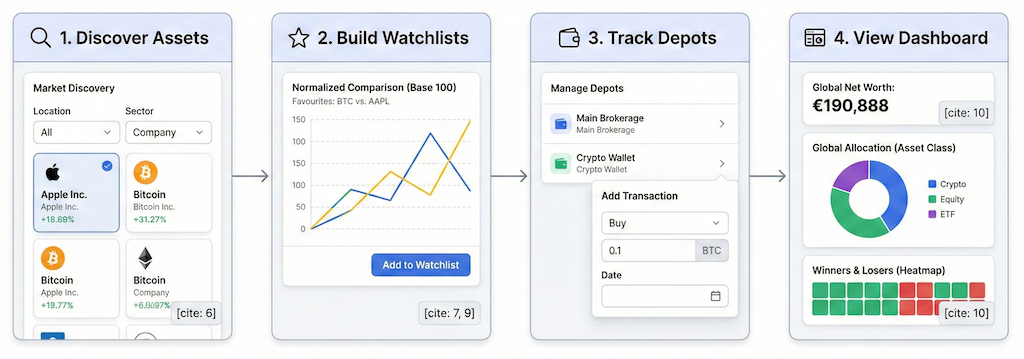
Step 1: Search for Organizations and Instruments
Before you track anything, browse the assets available in our database. It’s public and easy to explore.
- Click "Search" in the top navigation bar or go to the Market Screener.
- Start typing the name of any organization (e.g., Apple Inc. or MicroStrategy) and select it from the dropdown.
- Organization Page: Here you will see fundamental data (employees, location) and a list of all financial instruments linked to that company.
- Instrument Page: Click on a specific ticker (e.g.,
AAPL) to see detailed price charts and market data.
This is how most users start: just poking around to see what is available.
Step 2: Get Your First Watchlist
When you register for an account, FinSxS automatically creates your first watchlist called "Favourites". No setup is required. It is waiting for you the moment you log in.
Step 3: Add Your First Instrument
- From the Screener or Search bar, click into any instrument (e.g., BTC - Bitcoin or AAPL - Apple Inc.).
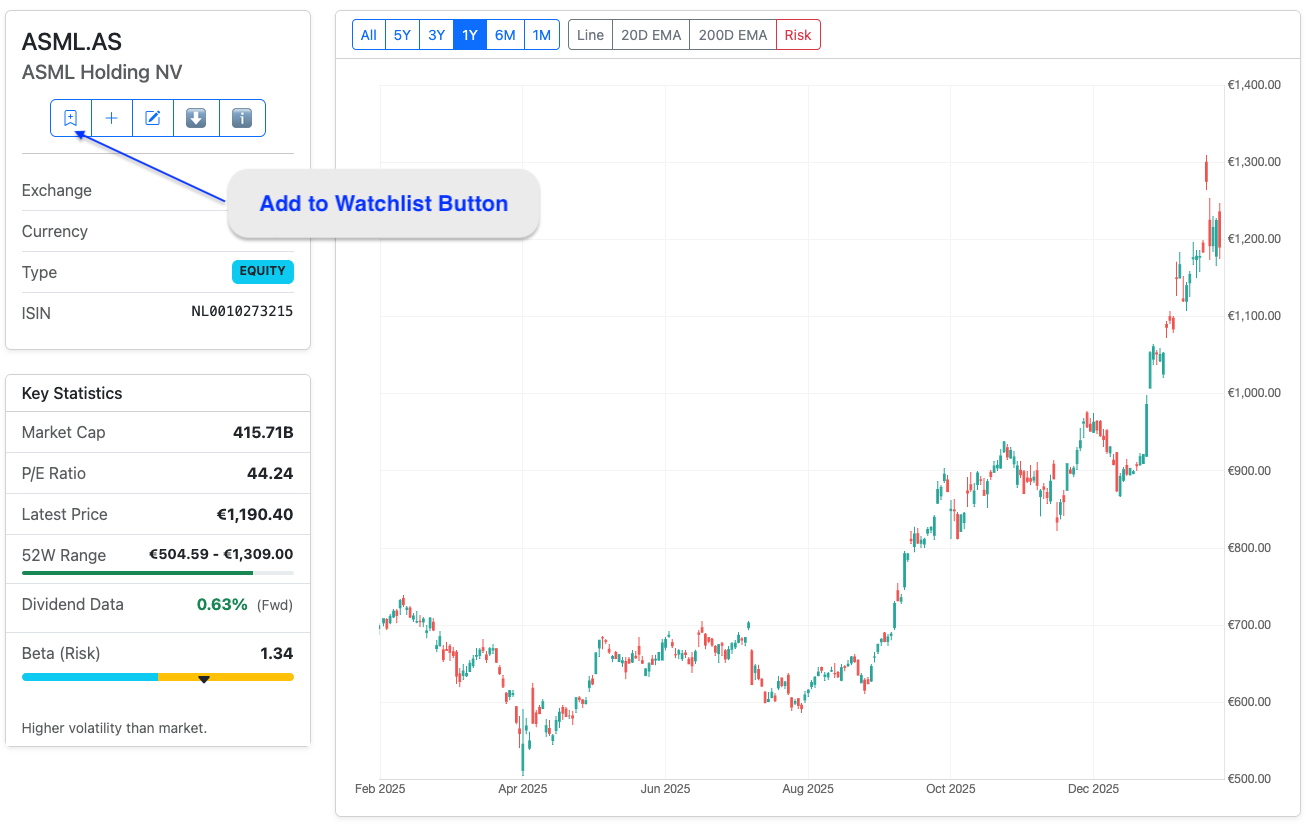
- Look for the "Add to Watchlist" button (usually located near the top of the details panel).
- Select "Favourites" from the list.
- Done! It is now being tracked.
Tip: We recommend adding 3–5 different types of assets (e.g., one crypto, one tech stock, and a Gold ETF) to see how they behave differently.
The "Add to Watchlist" button
Step 4: Open Your Watchlist & Compare Side-by-Side
This is the "Aha!" moment for most users.
- Click Watchlists in the navbar (or click here).
- Open your "Favourites" list.
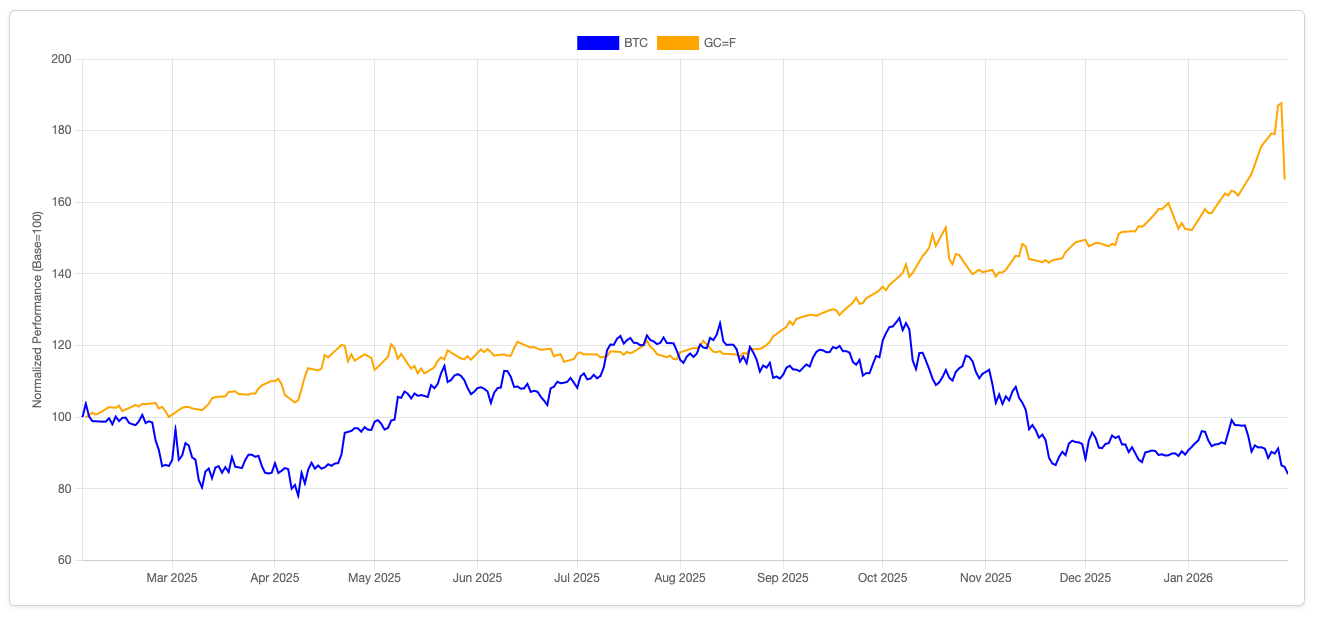
- The FinSxS Difference: We normalize the charts (Base 100). This allows you to fairly compare Bitcoin’s high volatility against Apple’s steady growth or Gold’s stability on a single chart without distorted scales.
- Play with custom date ranges (e.g., 1 Year, YTD) to spot relative winners and losers.
Watchlist Chart showing Normalized BTC vs. AAPL
Step 5: Create More Watchlists
One list is great, but separate ones help organize your ideas.
- Inside the Watchlists page, click "Create New Watchlist".
- Give it a name (e.g., "Tech Growth", "Crypto Hedges", or "Dividend Plays").
- Add instruments just like before.
- Pro Tip: Use watchlists for "Paper Trading"—track ideas here for a few weeks to test your hypothesis before committing real money.
Step 6: When You're Ready, Start Tracking (Depots)
Once you have explored the market, tracking your real portfolio is the final step.
- Go to Portfolio → Manage Depots.
- Create a depot (e.g., "Main Brokerage").
- Add transactions (Buy/Sell/Deposit) directly from the instrument page you are viewing.
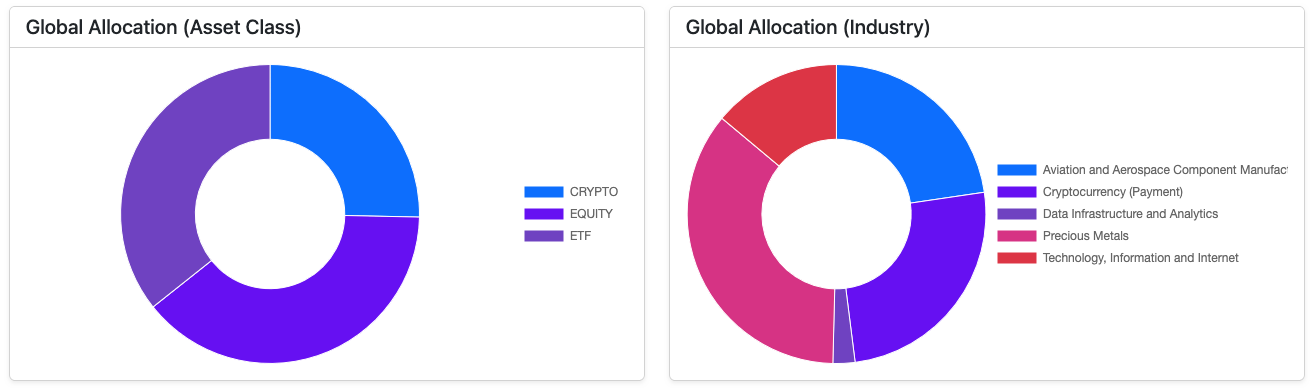
- Return to the Dashboard to see your Global Net Worth, Allocation Pies, and Profit & Loss heatmap.
Where to Go Next
Questions? Check the Help section or use the feedback button in the app.
Happy discovering!
The FinSxS Team